
Business Electricity Rates in PA, NJ, and DE
Demand charges run 30-70% of a commercial electric bill in PA, NJ and DE. See what drives your rate and which charges solar and storage can reduce.
In this article
By the Sunwise USA Commercial Energy Team · NABCEP-certified commercial solar designers serving Pennsylvania, New Jersey, and Delaware · Last updated July 2026
New Jersey businesses paid 17.86 cents per kilowatt hour for electricity in May 2026, 32 percent above the national commercial average. Pennsylvania businesses paid 13.56 cents, up 14.5 percent in a single year, roughly three times the national rate of increase. Delaware sat at 13.39 cents.
This guide is written for business owners, facility managers, and operators in these three states who want to understand what they are paying and what can actually be done about it. It covers current commercial rates, the four components of a commercial electricity bill, how plan structures and usage habits change the number, and the four levers available for reducing the total.
Running a household rather than a business? The drivers are different, and we cover them in why your home electric bill is so high.
Business electricity rates here are built from layers, and only one of them is competitive. That distinction drives everything else. Shopping changes the price per kilowatt hour. Energy efficiency changes how many kilowatt hours you consume. Demand management changes your peak. On site generation changes how much you buy from anyone at all. Each reaches a different part of the bill.
Key Takeaways
- According to the U.S. Energy Information Administration, commercial customers paid 17.86 cents per kilowatt hour in New Jersey, 13.56 cents in Pennsylvania, and 13.39 cents in Delaware in May 2026, against a national commercial average of 13.54 cents.
- Pennsylvania commercial rates rose 14.5 percent year over year, roughly three times the national increase of 4.7 percent.
- Demand charges account for 30 to 70 percent of the total bill for large commercial customers, and no supplier contract reduces them.
- All three states operate deregulated electricity markets, so businesses may choose their electricity provider for supply while the local utility continues delivering the power.
- PJM capacity auction prices have risen more than 800 percent, and those costs reach default utility rates and third party contracts alike.
- Four levers reduce commercial electricity costs: shopping the supply rate, energy efficiency, demand management, and on site generation. Only the last three change how much electricity you buy.
What Are Average Business Electricity Rates in PA, NJ, and DE?
According to the U.S. Energy Information Administration, commercial customers in New Jersey paid an average of 17.86 cents per kilowatt hour in May 2026, Pennsylvania 13.56 cents, and Delaware 13.39 cents. The national commercial average that month was 13.54 cents per kWh.
| State | May 2026 | May 2025 | YoY | 2023 annual | Change since 2023 |
|---|---|---|---|---|---|
| New Jersey | 17.86¢ | 16.55¢ | +7.9% | 14.00¢ | +27.6% |
| Pennsylvania | 13.56¢ | 11.84¢ | +14.5% | 11.26¢ | +20.4% |
| Delaware | 13.39¢ | 12.33¢ | +8.6% | 11.83¢ | +13.2% |
| U.S. average | 13.54¢ | 12.93¢ | +4.7% | 12.59¢ | +7.5% |
Sources: monthly figures from EIA Electric Power Monthly, Table 5.6.A (Form EIA-861M), May 2026, preliminary estimates based on a cutoff model sample. Annual 2023 figures from EIA Table 4 (Form EIA-861), final data.
Large commercial accounts typically pay below these per-kWh averages but add demand charges, which the average does not capture.
Why New Jersey is different
New Jersey commercial rates sit 32 percent above the national average and roughly a third higher than neighboring Pennsylvania. Only New England, New York, California, and Hawaii are higher. The gap traces to a combination of the state’s BGS auction structure, transmission and capacity costs in the PJM zones serving the state, and the Societal Benefits Charge recovered through delivery.
The practical consequence is that identical facilities in Camden and Philadelphia, twenty minutes apart, face materially different economics. A New Jersey business reduces roughly 32 percent more cost per kilowatt hour avoided than a Pennsylvania one, which changes the payback math on efficiency and generation alike.
Market structure by state
| State | Default Service | Shopping Platform | Major Utility Companies |
|---|---|---|---|
| Pennsylvania | Price to Compare (PTC) | PAPowerSwitch | PECO, PPL, Met-Ed, Penelec, West Penn Power, Duquesne Light |
| New Jersey | Basic Generation Service (BGS) | NJPowerSwitch | PSE&G, JCP&L, Atlantic City Electric, Rockland Electric |
| Delaware | Standard Offer Service | No state platform, DE PSC certified supplier list | Delmarva Power, Delaware Electric Cooperative* |
What Is on a Commercial Electricity Bill?
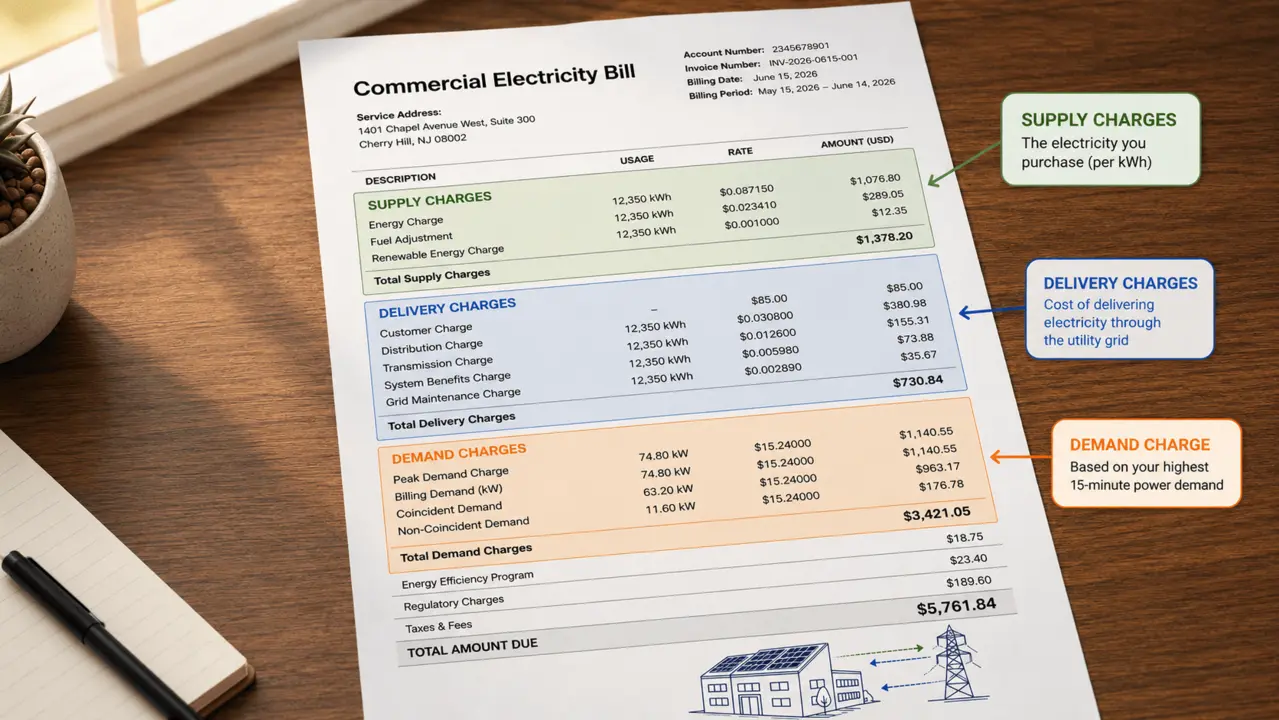
A commercial electricity bill in Pennsylvania, New Jersey, and Delaware has four standard components: supply charges, delivery charges, demand charges, and regulatory fees and taxes. Supply and delivery charges are typically bundled into the rate you are quoted, while demand charges and regulatory items are billed separately or embedded without appearing as line items.
Supply charges (generation)
Supply charges are the cost of the electricity itself, billed per kilowatt hour. This is the only competitive layer: in all three states you can buy supply from your utility’s default service or from a licensed third party provider. It is also the layer that has absorbed the brunt of the PJM driven increases.
Delivery charges (distribution and transmission)
Delivery charges cover the poles, wires, transformers, substations, and maintenance crews that move power to your building, and they are set by your local utility regardless of who supplies your energy. Infrastructure maintenance costs are recovered through these charges, which utilities set through rate cases before their state commissions. PECO, PPL, PSE&G, JCP&L, Atlantic City Electric, and Delmarva each file separately. You cannot shop this layer. You can only reduce how much of it you buy.
Demand charges
Demand charges bill your peak rate of draw in kilowatts, separately from your total consumption in kilowatt hours. Commercial rate classes measure the highest short interval energy demand your facility hits within each billing cycle and bill it across the whole month.
The logic is that the grid must be built to serve your peak, not your average. The consequence: a facility that idles at modest draw but spikes hard, compressors starting simultaneously, an electric oven bank firing at opening, machinery cycling at shift start, pays for that peak demand all month. For large businesses, demand charges commonly run 30 to 70 percent of the total bill.
This is why two businesses with identical monthly kWh can receive wildly different bills, and why “what is your electricity rate” is an incomplete question for any serious commercial account.
Regulatory fees and taxes
Regulatory fees and taxes are the fourth component, usually embedded in the rates above rather than broken out as separate lines. New Jersey bills carry a Societal Benefits Charge funding efficiency and clean energy programs, plus applicable sales tax. Pennsylvania recovers a gross receipts tax through supply pricing along with surcharges funding energy efficiency programs. Delaware applies a public utility tax.
These items are the reason a quoted cents per kWh rate and the number at the bottom of your invoice rarely match. Any comparison between a provider offer and your current bill should be made on an all in basis, not against the supply line alone.
Can Businesses Choose Their Electricity Provider in PA, NJ, and DE?
Yes. Pennsylvania, New Jersey, and Delaware all restructured their markets in the late 1990s, separating generation (competitive) from delivery (regulated monopoly). In these deregulated markets you may choose among multiple business electricity providers for supply, while your utility keeps delivering the power either way.
Pennsylvania
Pennsylvania opened retail choice under the Electricity Generation Customer Choice and Competition Act. Businesses that do not shop receive default service priced at the utility’s price to compare, which resets quarterly for most rate classes. PAPowerSwitch is the state’s official platform to compare business electricity rates, and offers are benchmarked against the PTC. With commercial rates up 14.5 percent year over year, the gap between shopping and defaulting has widened.
New Jersey
New Jersey restructured under the Electric Discount and Energy Competition Act of 1999. The default is Basic Generation Service, procured through an annual BGS auction, which is why New Jersey default rates step rather than drift: each February’s auction sets the next year’s pricing. NJPowerSwitch is the official shopping platform. The 2025 auction cycle, absorbing the PJM capacity surge, pushed BGS rates up roughly 17 to 20 percent across the four utilities.
Delaware
Delaware restructured in 1999 as well. Delmarva Power commercial customers can choose a provider, with non shoppers receiving standard offer service. Delaware Electric Cooperative and municipal utility customers generally do not have retail choice. There is no state run comparison platform equivalent to PAPowerSwitch or NJPowerSwitch; the Delaware Public Service Commission publishes the list of certified electricity suppliers instead.
Fixed or Variable Rate: Which Commercial Electricity Plan Fits?
The right energy plan depends less on the headline number than on how your business operates and how much rate volatility your budget tolerates. Commercial electricity plans in this region fall into five broad structures.
| Plan Structure | Where It Fits | What to Watch |
|---|---|---|
| Fixed rate contracts | Businesses wanting a locked in rate and predictable energy expenses across a budget year | Teaser periods rolling into variable rates; pass through clauses that make the fixed rate fixed in name only |
| Variable rate plans | Low volume accounts, or businesses expecting default rates to fall | Rates reset with market conditions monthly or quarterly; no ceiling |
| Blended / indexed | Large businesses with procurement capacity and tolerance for market fluctuations | Requires internal capacity to monitor and act on the wholesale market |
| Energy-only rates | Businesses wanting the lowest headline number that can absorb pass-through risk | Excludes capacity, transmission, and ancillary costs, the components rising fastest |
| Green energy plan | Businesses with sustainability commitments met through renewable energy credits | You are buying RECs, not differently generated power; typically a premium per kWh |
Fixed rate contracts
Fixed rate contracts lock a supply rate for a defined term, typically 6 to 60 months. They suit businesses that need predictable energy expenses for budgeting. The caution is that a fixed rate is not always fixed: pass-through provisions can forward capacity and transmission cost increases mid-contract.
Variable rate plans
Variable rate plans reset monthly or quarterly with market conditions. They can beat fixed pricing when default rates are falling, but they carry no ceiling, which makes them difficult to budget against in a market rising at 14.5 percent annually.
Blended and indexed plans
Blended and indexed structures split load between fixed and market pricing. They suit large businesses with procurement capacity and tolerance for market fluctuations, and they generally require someone internally who monitors the wholesale market and can act on it.
Energy-only rates versus all-in rates
An energy-only rate covers generation but excludes capacity, transmission, and ancillary service costs, which pass through separately as incurred. An all-in or fully bundled rate includes them.
Energy-only quotes look cheaper because they are quoting less. In a market where PJM capacity costs have risen more than 800 percent, the excluded components are precisely the ones that have moved most, which means an energy-only contract can end up costing more than the all-in offer it beat on paper. When you compare rates across providers, confirm which components each quote includes before comparing the numbers. This is the most common way two quotes are made to look comparable when they are not.
Green energy plans
Green energy plans bundle renewable energy credits with conventional supply, usually at a premium per kWh. They satisfy sustainability reporting commitments efficiently. What they do not do is covered further below.
When your current contract expires
When your current contract expires, most agreements convert to month-to-month variable pricing unless you act. That default is usually the most expensive rate available on the contract, and it applies automatically.
Begin comparing offers 60 to 90 days before expiration. That window gives time to gather interval data, request quotes from multiple energy companies, and negotiate without deadline pressure. Record the expiration date and the required notice period when you sign, not when the renewal letter arrives, many agreements require written notice 30 to 60 days out to avoid auto-renewal.
How Do Usage Habits and Peak Hours Affect Your Rate?
Commercial pricing responds to how much energy you use and when you use it, not just the total. Two businesses in the same building on the same tariff can pay materially different amounts. Providers price against a projected usage volume, and utilities price peak demand separately from consumption; between them, your load profile does more to set your effective electricity rate than the provider you pick.
Peak hours versus off peak hours
Where operations allow shifting load, moving energy usage away from system peaks reduces supply cost on time-of-use structures and can lower the peak that sets demand charges. Restaurants, warehouses running multiple shifts, and any facility with schedulable equipment have the most room here.
Usage volume
Higher and steadier consumption generally earns better per kWh pricing, because predictable load is easier for a provider to hedge. This is also why bandwidth clauses exist: if your actual usage deviates significantly from the projection the contract was priced against, the provider can reprice.
Load factor
Load factor is the ratio of your average draw to your peak draw. Low load factor facilities, those that spike hard and idle low, pay disproportionately, because they are charged for grid capacity they use only briefly. Raising load factor is often cheaper than raising efficiency.
Interval data
Your utility holds 15-minute interval records for most commercial meters, and that data is what any credible analysis of your energy needs starts from. An annual kWh total cannot tell you when your peak occurs, and therefore cannot tell you whether load shifting, efficiency work, or on-site generation would reduce your bill.
What Do Business Electricity Costs Look Like by Business Type?
The right strategy depends on your business model. A warehouse and a restaurant with identical annual consumption have almost nothing in common in how their energy costs are structured.
| Business Type | Typical Load Profile | Where the Savings Sit |
|---|---|---|
| Warehouse / distribution | Steady daytime draw, large roof area, modest peak | On-site generation, usage aligns with production hours |
| Manufacturing | High peak demand at shift start; machinery cycling | Demand management first; generation second |
| Retail / restaurant | Peak hours track opening and service periods | Plan structure, energy efficiency, off peak hours shifting |
| Office / professional | Predictable weekday load, low peak variance | Contract terms and energy efficiency measures |
| Property management | Multiple meters, mixed rate classes, varying business types | Portfolio-level rate structure review across all service locations |
Small business owners on low-volume accounts typically get the most from plan structure and contract discipline, since demand charges may not apply to their rate class at all. Large businesses and multi-site operators get more from attacking peak demand and generation, because that is where the majority of their bill actually sits. Property management portfolios sit between the two: the opportunity is usually consolidating rate class review across service locations rather than optimizing any single meter.
Are Third-Party Electricity Providers Cheaper Than the Utility?
Sometimes, and the gap is usually modest. A third-party provider competes against your utility’s default rate, and when default rates reset upward, as BGS did, a provider locking a fixed rate below the new default delivers genuine savings. Fixed rate contracts also buy budgeting certainty that quarterly-resetting default service does not.
Supplier shopping has a defined ceiling, and it helps to know where it sits:
Every provider buys from the same wholesale market. PJM costs, including the capacity surge, reach every contract. A provider can time the market and shave margin; it cannot make the underlying power cheaper. That is why offers from different suppliers tend to cluster within a fairly narrow band.
The contract is the product. Commercial supply agreements carry structures that deserve scrutiny: teaser fixed periods rolling into variable rates, bandwidth clauses that reprice you if usage deviates from projections, energy-only structures that exclude the fastest-rising cost components, pass-through provisions that forward capacity and transmission increases mid-contract, and early termination fees that limit your ability to act on a better offer.
Demand charges survive shopping. Provider contracts address the supply layer of your electricity service only. Delivery charges and demand charges, for many facilities the majority of the bill, are untouched by switching.
What Does a Green Energy Plan Actually Buy?
A green energy plan does not change the electrons reaching your building. It bundles renewable energy credits with conventional supply, typically at a premium per kWh. For businesses with reporting obligations or sustainability commitments, that is a legitimate and efficient instrument.
It is worth being precise about what it does not do. Renewable energy credits do not reduce your consumption, your delivery charges, or your peak demand. On-site renewable energy generation does all three. Many businesses use both: credits to cover the load they cannot generate, generation to structurally remove the load they can.
Why Are Commercial Electricity Rates Rising in PA, NJ, and DE?
The dominant driver is the PJM capacity market, where recent auctions have cleared at increases exceeding 800 percent. Three factors are behind it: data center demand growth, accelerated power plant retirements, and an interconnection queue backlog that delays new supply from reaching the market. The July 2025 and December 2025 auctions both cleared at record price caps.
The effect is visible in the state data. Pennsylvania commercial rates rose 14.5 percent between May 2025 and May 2026, against a national increase of 4.7 percent. Delaware rose 8.6 percent and New Jersey 7.9 percent, from an already high base. Measured against 2023, New Jersey commercial rates are up 27.6 percent and Pennsylvania 20.4 percent.
Those capacity costs flow into every pricing mechanism in the region, New Jersey’s BGS auctions, Pennsylvania’s price-to-compare resets, Delaware’s standard offer service, and third-party contracts alike. The imbalance is expected to persist for several years, which means businesses should plan against a higher baseline rather than wait for a reversal.
- Capacity costs reach default utility rates and provider contracts alike. No contract structure avoids them.
- Elevated commercial rates are expected to persist for multiple years, not quarters.
- Trimming energy usage at the margin will not offset increases of this magnitude on its own.
- The levers that reduce consumption and peak demand grow more valuable as the price per kWh rises.
Four Levers for Reducing Commercial Electricity Costs
Most businesses treat electricity cost reduction as a shopping exercise, and shopping is a real lever. It is also the only one of four that leaves your consumption unchanged. Each lever reaches a different layer of the bill, and the right combination depends on your load profile rather than on what a vendor sells.
| Lever | What It Changes | Bill Layer It Reaches | Typical Best Fit |
|---|---|---|---|
| 1. Shop the supply rate | Price per kWh | Supply only | Every business, at every renewal |
| 2. Energy efficiency | Total kWh consumed | Supply and delivery | Older buildings; lighting- and HVAC-heavy facilities |
| 3. Demand management | Peak kW drawn | Demand charges | Low load factor facilities, manufacturing, cold storage |
| 4. On-site generation | kWh purchased from anyone | Supply, delivery, sometimes demand | Large roof area, significant daytime load |
Lever 1: Shop the supply rate
Shopping changes the price you pay per kilowatt hour and nothing else. Done carefully it shaves margin, times resets, and buys term certainty, and it should be done at every renewal regardless of what else you pursue. What it cannot do is change your exposure to the market, because every contract ultimately prices the same rising wholesale reality, and the delivery and demand layers never enter the competition at all.
Lever 2: Energy efficiency
Energy efficiency reduces the number of kilowatt hours a facility consumes, which lowers supply and delivery charges simultaneously. For many commercial buildings it delivers the fastest payback of any lever, because it requires no market timing and no large capital outlay.
The measures that typically pay back fastest in commercial facilities: LED lighting retrofits, HVAC scheduling and controls, variable frequency drives on motors and pumps, building automation systems, compressed air leak repair, and refrigeration controls in food service and cold storage.
Both Pennsylvania and New Jersey run ratepayer-funded commercial energy efficiency programs that offset project cost. Pennsylvania utilities administer programs under Act 129; New Jersey’s run through the state’s Clean Energy Program, funded by the Societal Benefits Charge already on every bill. Delmarva offers commercial incentives in Delaware. A business that does not use these programs is paying for them regardless.
One honest limit: efficiency reduces consumption but does not necessarily reduce peak demand. A facility that cuts total kWh by 20 percent while keeping the same startup spike sees its demand charges largely unchanged. Efficiency and demand management are different problems requiring different measures.
Lever 3: Demand management
Demand management targets peak kilowatts rather than total kilowatt hours. Because demand charges commonly run 30 to 70 percent of a large commercial bill, this is frequently the largest single opportunity on the account, and it is one that supplier shopping alone does not reach.
- Staggered equipment startup: sequencing large motors, compressors, and HVAC so they do not draw simultaneously. Often the cheapest measure available, requiring scheduling changes rather than equipment.
- Demand controllers: automated systems that shed non-critical load when draw approaches a set threshold.
- Battery storage: discharging during peak intervals to flatten the measured peak, which also pairs with on-site generation.
- Demand response: PJM compensates commercial customers for curtailing load during system peak events, through programs administered by curtailment service providers. This is revenue rather than savings, and it stacks with the measures above.
- Process scheduling: moving batch operations, charging, and non-time-critical loads to off peak hours.
Interval data is prerequisite for all of it. Without knowing when your peak occurs and which equipment causes it, demand management is guesswork.
Lever 4: On-site generation
On-site solar generation changes the quantity of grid electricity a facility buys rather than the price paid per unit. Energy produced on your roof is supply you do not purchase from anyone, at a cost fixed on installation day and immune to every future auction, reset, and pass-through. For facilities with meaningful daytime load, it can also flatten the consumption profile that drives demand charges, though only when generation coincides with the peak.
The value scales with the rate you avoid, which is why the economics differ sharply across the region. A New Jersey facility avoiding 17.86 cents per kilowatt hour reaches payback substantially faster than a Pennsylvania one avoiding 13.56 cents on the same installed cost.
The federal tax picture changed on July 4, 2026, and where a project sits relative to that date determines the math. Projects that began construction on or before July 4 preserved the full 30 percent Section 48E Investment Tax Credit, with roughly four years to reach service. Projects that did not must be placed in service by December 31, 2027 to claim it. Whether that is achievable depends on your site, and it is the first thing to establish: a typical commercial project runs 6 to 12 months from design through interconnection, so the schedule is worth mapping against that date early. The two questions to settle for any 2026 project are whether your installer holds a documented begin-construction position and whether the equipment satisfies the foreign entity sourcing thresholds that now apply. MACRS accelerated depreciation is unaffected by any of this and still reduces net cost substantially on its own.
Shopping optimizes the variable cost. Efficiency and demand management reduce what you buy. Generation converts the remainder to a fixed cost. The most effective commercial energy strategies in this region use all four.
See What Your Bill Is Made Of
Send us one recent electricity bill and Sunwise will return a line-by-line breakdown: supply versus delivery charges versus demand charges, what your current rate structure is costing you, and which of the four levers would move the number most for your facility. Our energy experts use your business address and service location to pull the relevant utility tariff, so the review reflects your actual rate class rather than a regional average. You keep the analysis either way, including the efficiency and demand management steps that improve the result alongside generation.
What is the average business electricity rate in PA, NJ, and DE?
According to the U.S. Energy Information Administration, commercial customers paid an average of 17.86 cents per kilowatt hour in New Jersey, 13.56 cents in Pennsylvania, and 13.39 cents in Delaware in May 2026. The national commercial average was 13.54 cents. New Jersey sits 32 percent above the national figure; Pennsylvania and Delaware sit close to it. These averages cover consumption only, large commercial accounts pay demand charges on top.
Why are New Jersey business electricity rates so high?
New Jersey commercial rates were 17.86 cents per kilowatt hour in May 2026, roughly a third higher than Pennsylvania and 32 percent above the national average. Only New England, New York, California, and Hawaii are higher. The gap reflects the state’s annual BGS auction structure, transmission and capacity costs in the PJM zones serving New Jersey, and the Societal Benefits Charge recovered through delivery rates. The practical effect is that every kilowatt hour a New Jersey business avoids is worth about a third more than the same kilowatt hour in Pennsylvania.
What are demand charges on a commercial electricity bill?
Demand charges bill a business for its highest rate of electricity draw during the billing cycle, measured in kilowatts over short intervals, separately from total consumption. A facility that briefly spikes to a high draw pays for that peak all month. For large commercial customers, demand charges commonly account for 30 to 70 percent of the bill, which is why two businesses using identical kWh can pay very different totals.
What is an energy-only rate?
An energy-only rate covers generation but excludes capacity, transmission, and ancillary service costs, which pass through separately as incurred. An all-in or fully bundled rate includes them. Energy-only quotes appear cheaper because they cover less, and in a market where PJM capacity costs have risen more than 800 percent, the excluded components are the ones rising fastest. Always confirm which components a quote includes before comparing it against another.
Does energy efficiency reduce demand charges?
Not necessarily. Energy efficiency reduces total kilowatt hours consumed, which lowers supply and delivery charges. Demand charges are billed on peak kilowatts, so a facility that cuts consumption 20 percent while keeping the same startup spike sees little change in its demand charges. Reducing demand requires measures aimed at the peak itself, staggered startup, demand controllers, storage, or load shedding.
Are there commercial energy efficiency rebates in PA, NJ, and DE?
Yes. Pennsylvania utilities administer commercial efficiency programs under Act 129, New Jersey runs programs through its Clean Energy Program funded by the Societal Benefits Charge, and Delmarva offers commercial incentives in Delaware. Because these programs are funded through charges already on your bill, a business that does not apply is subsidizing them regardless. Program specifics and funding cycles change, so confirm current offerings with your utility before scoping a project.
Who is the cheapest business electricity supplier in PA, NJ, or DE?
Rankings change with each reset, so there is no durable answer. Every provider buys from the same PJM wholesale market, which keeps offers clustered within a narrow band. The more useful question is which contract terms suit your usage volume and risk tolerance. A slightly higher fixed rate with no pass-through provisions and no early termination fee often beats a lower headline number carrying both.
Can businesses choose their electricity provider in PA, NJ, and DE?
Yes. All three states deregulated electricity generation in the late 1990s. Businesses can buy supply from a licensed third-party provider while the local utility continues to deliver electricity and maintain the lines. Businesses that do not choose receive default service: the price to compare in Pennsylvania, Basic Generation Service in New Jersey, and standard offer service in Delaware. Delaware Electric Cooperative and municipal utility customers are the exception and do not participate in retail choice.
Is a green energy plan worth it for a business?
It depends on the objective. A green energy plan bundles renewable energy credits with conventional supply at a premium, which satisfies reporting and sustainability commitments efficiently. It does not reduce your consumption, delivery charges, or peak demand. On-site generation does all three. Many businesses use both: credits for the load they cannot generate, generation for the load they can.
Does solar reduce demand charges?
It can, but not automatically. Solar reduces demand charges only when generation coincides with the facility’s peak draw. A warehouse that peaks at midday sees a real reduction; one that peaks at 6 a.m. shift start sees little without storage. Interval data determines which case applies, which is why a bill and load-profile review precedes any credible estimate.
Why are commercial electricity rates rising in the region?
The dominant driver is the PJM capacity market, where prices surged over 800 percent at recent auctions due to data center demand growth, power plant retirements, and a backlogged interconnection queue. The effect shows in the state data: Pennsylvania commercial rates rose 14.5 percent between May 2025 and May 2026 against a national increase of 4.7 percent. These are structural conditions expected to keep rates elevated for years.